Ispra - Control center
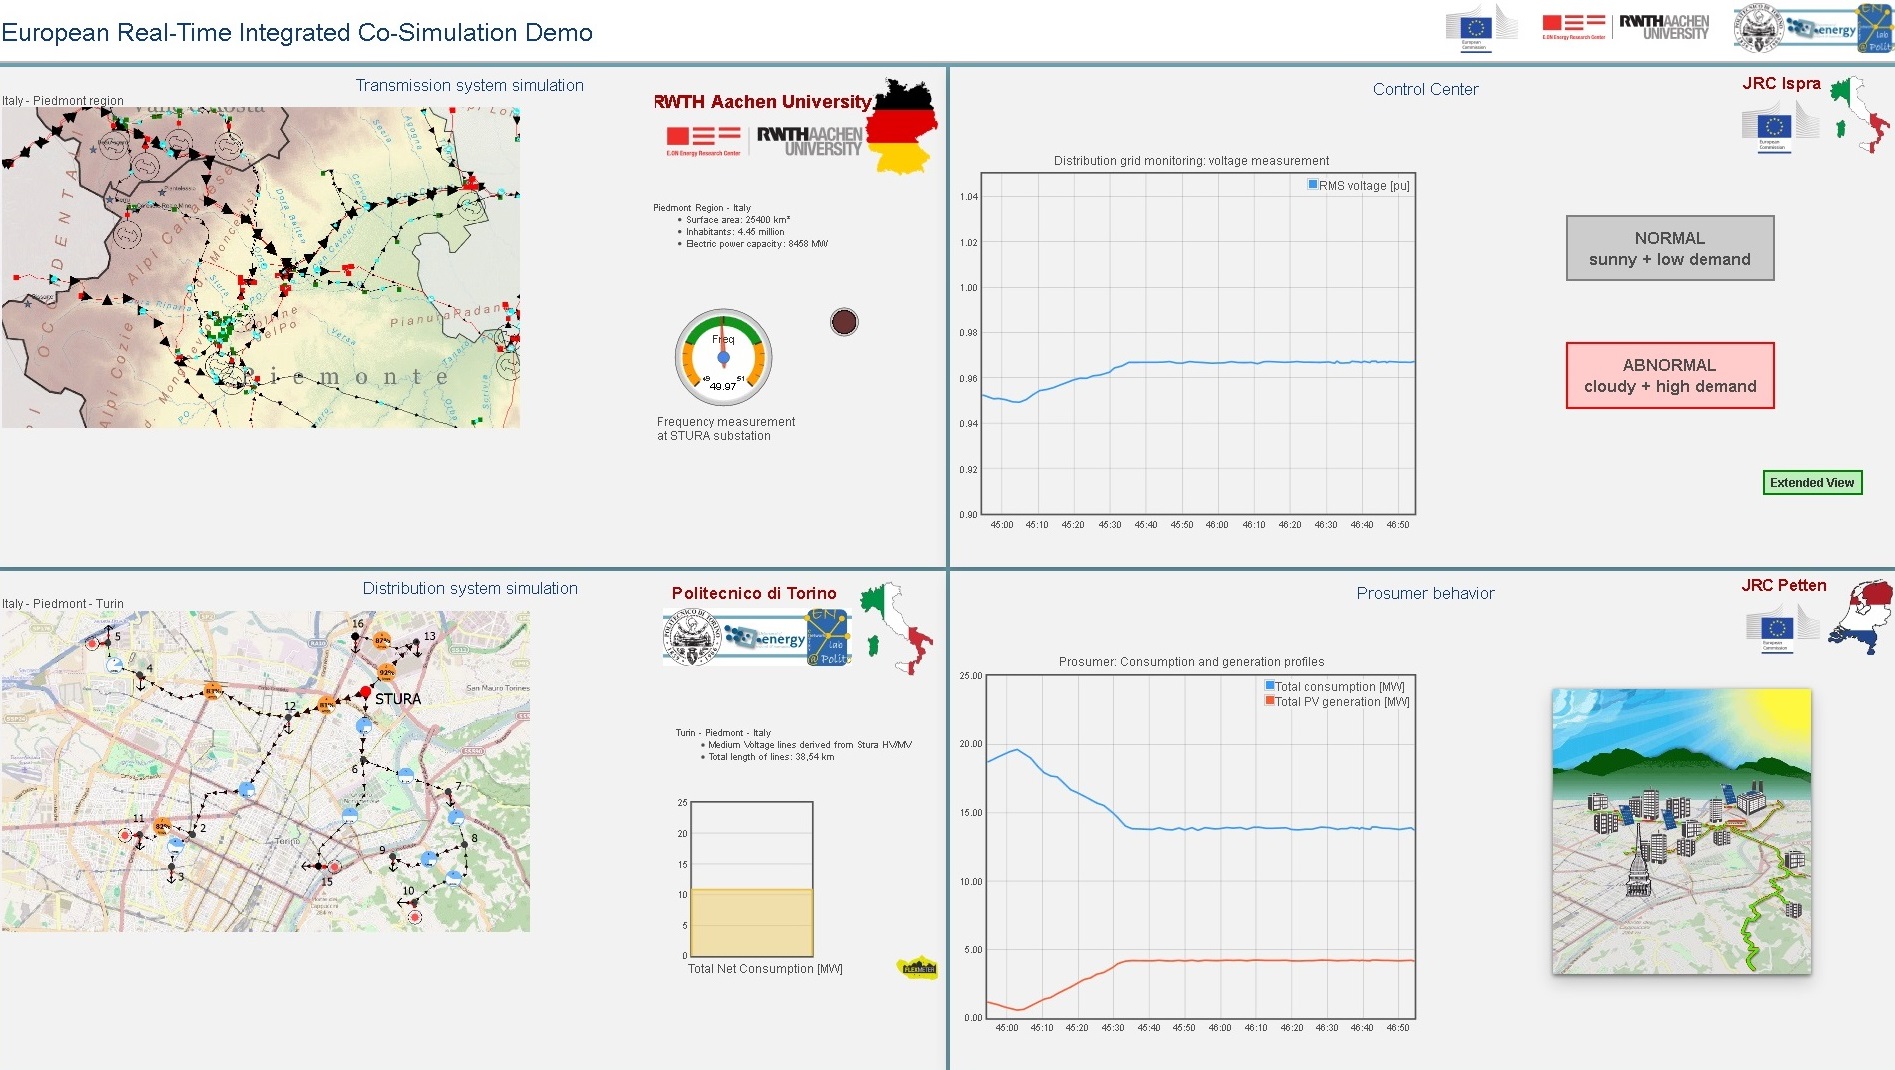
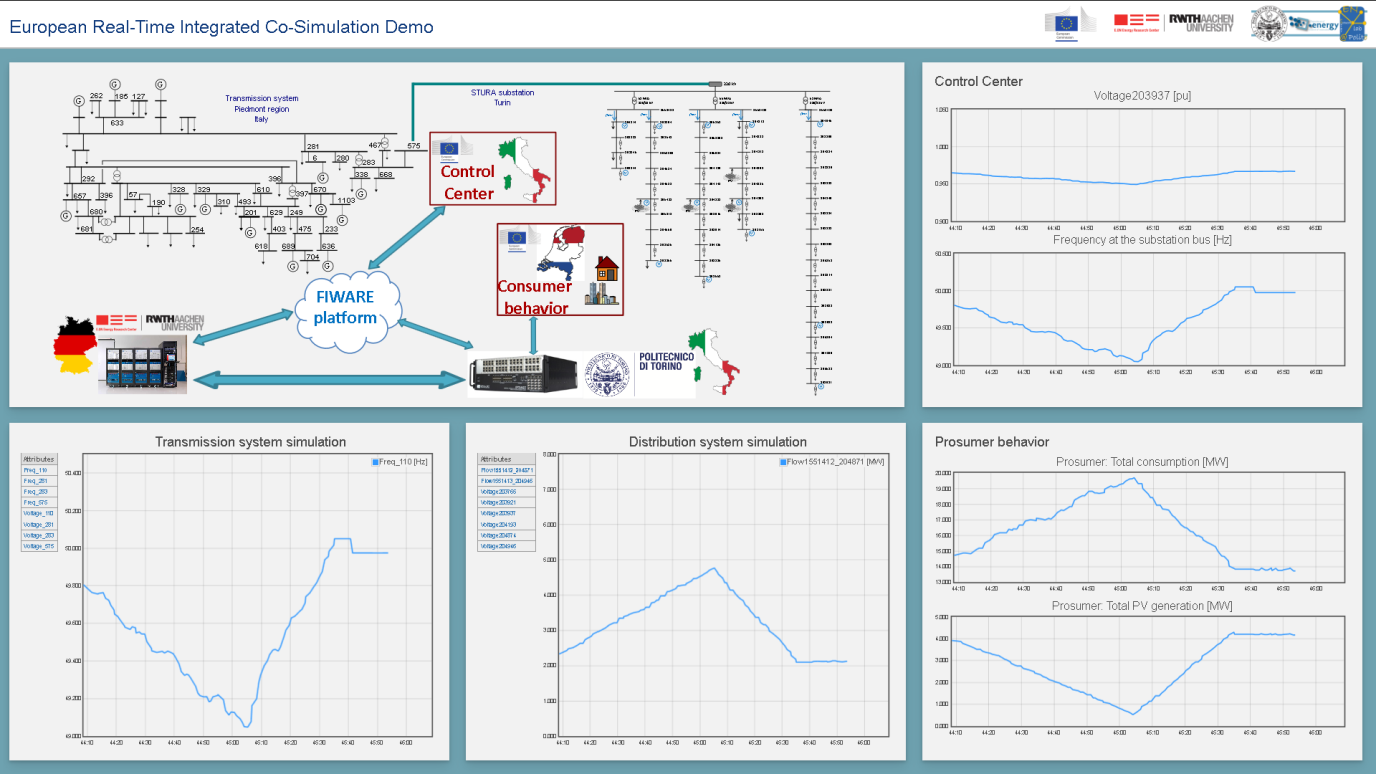
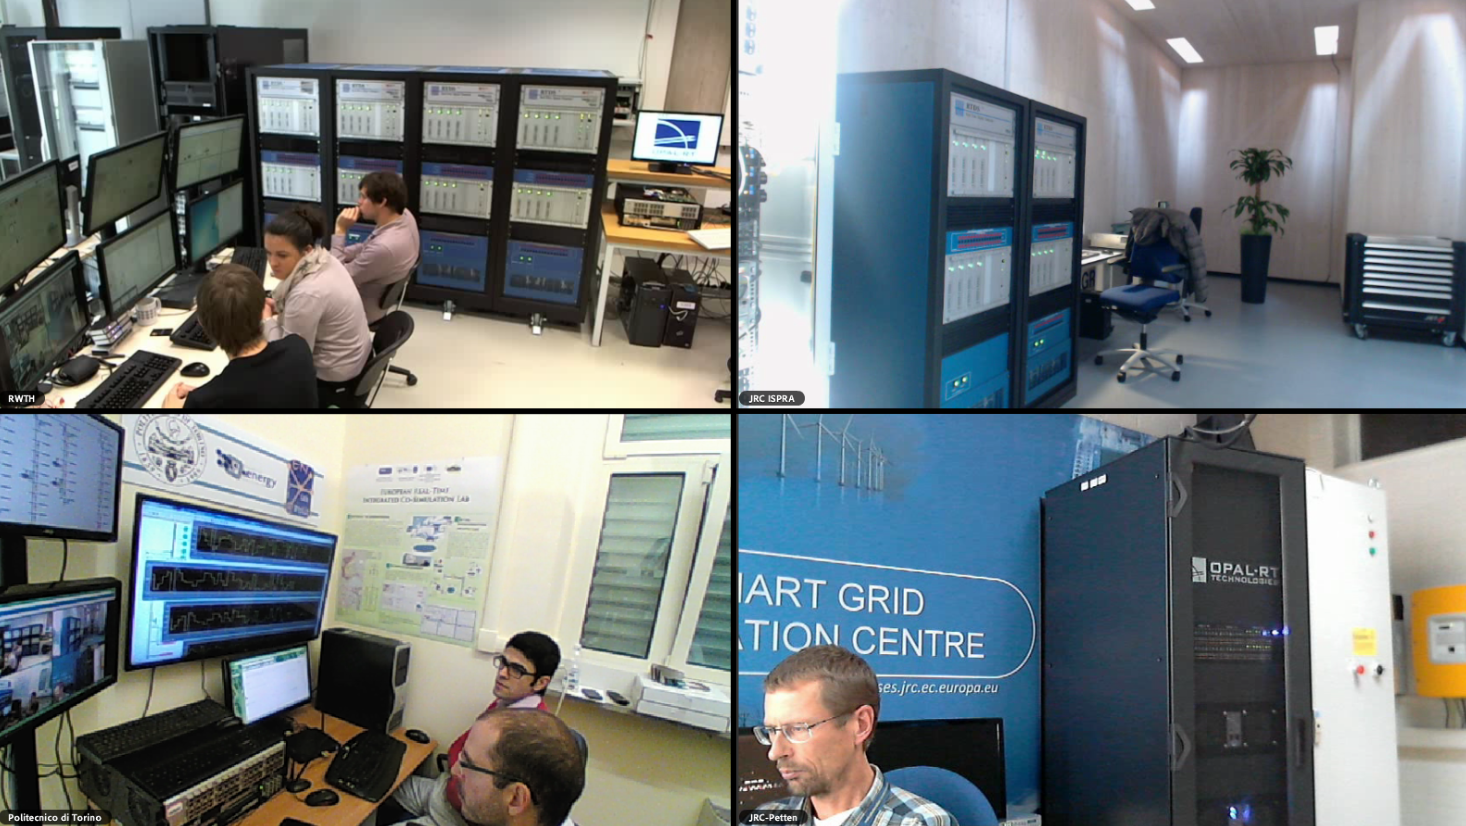
For the demonstration, two large screens were devoted: one to demonstrate a graphical representation of the co-simulation, and one to show live streaming of the 4 laboratories. The former screen was also used as a graphical interface enabling user to trigger the scenario and obtain consequent results visualized on some maps or charts. There was also a button on the touch screen to switch between 2 layouts, one as a high conceptual layout, and the other one as a technical layout to provide more details for the users or visitors with more power system expertise or interest. In this technical graphical interface, user can select any of the measurements listed next for any of the grids (transmission and distribution systems), in order to see the corresponding results as dynamic curves on the charts.